
The Power of Real-Time Dashboards in Modern Financial Operations

In the world of finance, speed and accuracy are everything. Decisions made a day late can cost millions, and delayed visibility into financial performance can leave even the best organizations blind to risks. That is why real-time dashboards have become more than just a reporting tool. They are now the central nervous system of modern financial operations.
Today’s finance leaders are not simply looking at quarterly reports. They are looking at live metrics streaming in from multiple systems —ERP, CRM, payroll, billing, and more —and translating those insights into immediate, high-impact actions. Real-time dashboards enable finance teams to see, predict, and react in ways static spreadsheets never could.
Let’s explore how real-time dashboards are redefining financial visibility, empowering more intelligent decision-making, and creating competitive advantage for modern businesses.
1. Why Financial Operations Need to Evolve
For decades, financial operations were reactive. Teams collected data from different departments, consolidated it at month-end, and produced static reports. By the time leadership saw the numbers, the reality had already changed.
In today’s environment, that approach is no longer sustainable. Markets shift by the hour, supply chains fluctuate overnight, and customer behaviors evolve in real time. Financial teams need the same immediacy of insight that sales and marketing teams have enjoyed for years.
This is where real-time dashboards come in. Instead of looking in the rearview mirror, they offer a living, breathing snapshot of your financial health at any given moment. Cash flow, expense ratios, receivables, and budget utilization are all visible in one place, updated every second.
That kind of visibility is not just about convenience; it is about agility. When a CFO can see revenue leakage happening in real time or identify anomalies before they snowball into significant losses, the organization becomes more proactive, resilient, and data-driven.
2. Turning Data Chaos into Clarity
Finance departments often sit on a goldmine of data, but it is scattered across multiple systems. You may have sales data in Salesforce, expense reports in Concur, accounting records in NetSuite, and operational data in spreadsheets. Without a unified view, it becomes difficult to connect the dots.
Real-time dashboards solve this fragmentation problem. They integrate data from multiple sources and display it in a single, visual interface. Instead of manually pulling data every week, the dashboard continuously syncs with your systems, keeping the metrics you see up to date.
Imagine a CFO opening a dashboard in the morning and instantly seeing:
- Current cash flow status compared to forecasts
- Department-wise spending trends
- Revenue growth by product line
- Aging reports for accounts receivable
- Alerts on any unusual spikes in expenses
That level of transparency can change the way finance operates. It removes guesswork, eliminates manual errors, and allows leaders to make faster, more confident decisions.
3. Real-Time Dashboards as a Decision Accelerator
Traditional BI financial reporting is retrospective. Dashboards, on the other hand, are predictive and prescriptive. By using live data, they do not just tell you what happened; they show you why it happened and what might happen next.
For instance, if your dashboard shows a sudden drop in gross margin, you can immediately investigate whether it is due to rising supplier costs, discounting trends, or declining sales volumes. That level of cause-and-effect visibility allows finance teams to take corrective action instantly.
Some advanced dashboards even include predictive analytics, allowing organizations to simulate “what-if” scenarios. You can adjust variables such as pricing, inventory, and interest rates to see potential financial outcomes. This empowers leaders to test strategies before implementing them, minimizing risk and maximizing ROI.
In essence, real-time dashboards turn financial operations into a living laboratory, where every decision is tested, measured, and optimized continuously.
4. Enhancing Collaboration Across Departments
Financial operations do not function in isolation. They intersect with sales, HR, procurement, and operations. Yet, many organizations still struggle with silos, each department working on its own reports, metrics, and definitions of success.
Real-time dashboards bridge these silos by creating a shared, transparent view of performance. When everyone —from the CFO to the department head —works from the same data source, alignment becomes effortless.
For example:
- The sales team can see how discounts impact overall profitability.
- The procurement team can track spending trends in real time.
- The HR team can monitor payroll costs against budgets.
- The operations team can correlate supply chain performance with financial outcomes.
This level of visibility promotes accountability. It encourages data-driven conversations rather than opinion-driven debates. Everyone can see the same truth, leading to faster decisions and a more unified execution strategy.
5. Driving Financial Resilience in Volatile Times
Economic volatility is the new normal. Whether it is inflation, market disruption, or geopolitical risk, uncertainty is always on the horizon. In such times, real-time dashboards act as an early warning system.
Instead of discovering financial trouble after the fact, organizations can spot leading indicators and take action early. For instance:
- If expenses start trending above budget, alerts can trigger immediate reviews.
- If cash reserves fall below a set threshold, finance can adjust credit lines or payment schedules.
- If revenue from a specific region declines suddenly, leaders can investigate and reallocate resources.
These capabilities are crucial for maintaining resilience. They give organizations the agility to pivot, preserve liquidity, and protect profitability even when conditions shift rapidly.
A PwC survey found that companies using real-time financial analytics were 33% more likely to outperform peers in volatile markets. The reason is simple: visibility drives agility, and agility drives survival.
6. The Role of Automation and AI in Real-Time Dashboards
The power of dashboards increases exponentially when combined with automation and AI. Modern platforms are not just data visualization tools; they are intelligent systems that can learn from patterns and trigger actions automatically.
For example, an AI-enabled dashboard can:
- Automatically flag unusual transactions or anomalies.
- Forecast future cash flow based on historical and real-time trends.
- Suggest budget reallocations to improve financial performance.
Use natural language queries, allowing users to ask, “What caused the increase in expenses this week?” and get instant answers.
This fusion of automation, analytics, and AI transforms dashboards from passive monitors into active decision partners. It allows finance teams to spend less time collecting data and more time strategizing.
7. Real-World Impact: How Companies Are Using Dashboards
Many leading financial organizations are already leveraging real-time dashboards to revolutionize their operations:
A fintech company used real-time dashboards to track payment flows across multiple currencies. They reduced reconciliation time by 60% and improved fraud detection accuracy.
A retail chain integrated POS, inventory, and finance systems into a single dashboard. It gave the CFO live visibility into store-level profitability, enabling quicker pricing and stocking decisions.
A manufacturing enterprise used dashboards to monitor production costs and supply chain expenses. Real-time cost alerts helped them reduce budget overruns by 25%.
The takeaway? Dashboards are not theoretical tools; they deliver measurable business outcomes.
8. Designing an Effective Real-Time Financial Dashboard
Not all dashboards are created equal. A poorly designed one can overwhelm users with too much information or irrelevant metrics. The most effective dashboards follow a few key principles:
Start with business goals, not data points. Every metric should align with a strategic objective, cash flow optimization, cost reduction, or revenue growth.
Keep it visual. Use charts, trend lines, and color codes to make complex data easy to grasp.
Focus on key performance indicators (KPIs). Limit each dashboard to the metrics that matter most to decision-making.
Enable interactivity. Allow users to drill down for deeper insights instead of cluttering the main view.
Ensure data accuracy and timeliness. A dashboard is only as good as the data feeding it. Integrate systems carefully and automate updates.
When designed thoughtfully, dashboards become more than reports; they become strategic instruments of control and insight.
9. Overcoming Implementation Challenges
Implementing real-time dashboards is not just a technical project; it is a change management initiative. Common challenges include:
Data silos and integration gaps across departments.
Resistance to change from teams used to traditional reporting.
Lack of data governance leading to inconsistencies.
Overwhelming complexity from too many metrics or unclear ownership.
The key is to start small. Identify one or two high-impact financial processes, like cash flow or expense tracking, and build dashboards around them. Once teams see the value, adoption spreads naturally.
It also helps to involve both IT and finance stakeholders early, ensuring that the technology and business goals stay aligned.
10. The Future of Financial Visibility
The next generation of financial dashboards will go beyond visualization. They will integrate deeper with AI, natural language interfaces, and predictive modeling. Finance leaders will no longer need to ask analysts for reports. Instead, they will simply ask the dashboard, “How will our cash position look next quarter?” and get an answer backed by data and machine learning.
This evolution will make financial operations more intelligent, agile, and human-centric. Teams will spend less time chasing numbers and more time driving strategy and growth.
Final Thoughts: From Data to Action
Real-time dashboards are not just about seeing numbers faster. They are about transforming how financial decisions are made. They close the gap between data and action, turning information into an engine of agility and growth.
In a world where financial stability depends on speed, accuracy, and foresight, dashboards are no longer optional; they are essential.
If your finance team is still spending hours building static reports or waiting for monthly closes to understand business performance, it is time to rethink your approach. Start with one dashboard. Track one key metric. See the difference it makes in how quickly and confidently your organization can respond.
Because in modern financial operations, real-time insight is not just power, it is survival.
Similar Articles
The demand for software delivery has never been higher. Applications must be delivered faster and on a scale like never before.
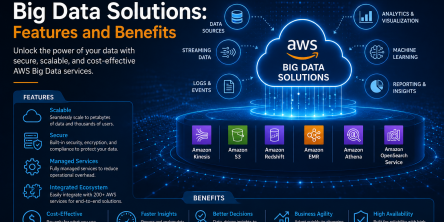
Modern businesses produce large amounts of data daily. Be it from customer transactions, Internet of Things (IoT) sensors, or countless other such sources.

Businesses today need to ship new software faster than ever. That's not news, of course. Anyway, because of the demands on businesses, new solutions are being built on top of micro-services, serverless functions, etc.

Cybersecurity has become an essential concern for groups, companies, and as well as people. As cyber threats enhance, security systems also become more sophisticated.
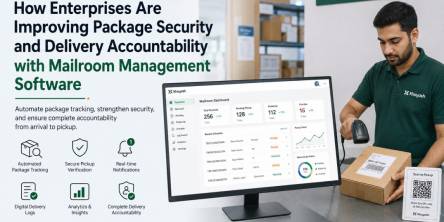
Enterprise workplaces today handle a massive volume of incoming packages, internal deliveries, courier shipments, and employee parcels every day

The adoption of cloud technologies around the world has changed the way software is consumed. Organizations now care more about agility and systems that scale with their business.
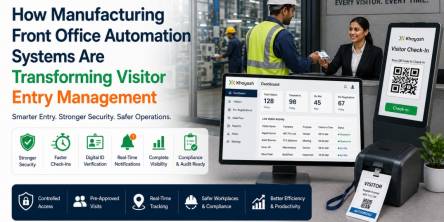
Modern industries are rapidly adopting digital transformation across operations, and manufacturing is no exception

The financial services industry is evolving. Banks, hedge funds, Fintech startups, etc. are all leveraging technology and implementing more sophisticated computational processes to keep up with the influx of information.
Information has become a critical resource in today’s business world. Businesses have been amassing large quantities of information over years but sometimes struggle to put it to use.