
Features of a Great Dashboard Reporting Software

For a business to run successfully you need a great dashboard reporting software. A good reporting software just reports data, but a great one is also interactive. It provides tools which allow you to drill down relevant data. It also allows the reader to further breakdown the data for detailed exploration and view data in a new light, which can be more interesting. With a great dashboard reporting software, related data about various topics/ functions can be viewed side by side for comparison and analysis. Key features of the software:
- Should be easy to use
- Should not be extremely expensive
- Should be easily accessible from any web server
- It should not mandate any SQL knowledge
- It should be equipped with a a straightforward and intuitive user interface
- Should provide the users with robust personalization options
- Visualization is the backbone
While selecting a software, first and foremost you need to ensure that it is equipped with attractive visuals. Visualisation is, after all, one of the most important functions of a dashboard reporting software and therefore an element of aesthetics comes into play here. The visual elements should be selected and applied so as to give the dashboard a purpose.
- The displayed colours play a major role
An exception dashboard needs to portray colours that are chosen with a rationale. To take advantage of conventional associations, for example, green is used to depict or signal “go”, orange for wait and red for stop. Such colour coding makes interpretation a lot easier and comprehendible.
- The depiction of charts and figures must be appropriate :
The chart or figure that is depicted by the software should be such that it flawlessly represents the data in question. For example, if it is reporting the monthly sales figures of a company over a year, it needs to be depicted by a histogram. On the other hand,if one is dealing with proportions of sales of various commodities in a year, then the best representation figure for the purpose would be a pie chart.
- Smart handling of data
Dashboards give us the freedom to track and report a wide range of data. Some of those data are useful while some are redundant. Good dashboards are expected to economise the use of time and effort while being used. That entails use of data optimally and with a purpose. Too much cluttering of data should be avoided in order to lose the Key Performance Indicators (KPIs) of a company. A good software is built to be capable of not just reporting KPIs, but also enabling the user to reach them both systematically and efficiently. The best dashboard reporting software should be able to track the progress to reach the KPIs, analyse the performance and uncover any shortcomings or lagging thereof. Some More Points Any successful company has to go through the failures and debacles. We all learn our lessons from them. These challenges are inevitable and enable the company to grow if taken care of. One of the most important functions of a dashboard reporting software is anticipating these challenges or shortcomings in time, and pave the way for timely intervention and prevention. Instead of simply pointing out the potential shortcomings and challenges, the ideal dashboard reporting software is the one that is able to guide the user in the right direction for resolving these issues. The focus should therefore, be more on the actionable data, i.e., data that enables the user to see a plan of action. That amounts to, in many ways, multiple metrics, which when assembled and viewed together, will often reveal a hence undiscovered relationship between them.
Similar Articles

The financial aid office has become one of the most operationally strained departments on the modern U.S. campus. FAFSA complexity, chronic staff turnover, tightening Title IV compliance obligations, and the persistent problem of unspent scholarship dollars have pushed administrators toward purpose-built financial aid management software
The demand for software delivery has never been higher. Applications must be delivered faster and on a scale like never before.
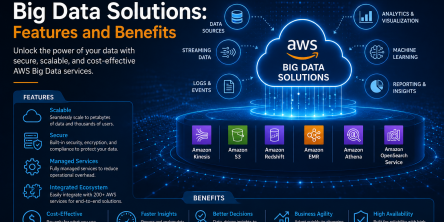
Modern businesses produce large amounts of data daily. Be it from customer transactions, Internet of Things (IoT) sensors, or countless other such sources.
Businesses today need to ship new software faster than ever. That's not news, of course. Anyway, because of the demands on businesses, new solutions are being built on top of micro-services, serverless functions, etc.

Cybersecurity has become an essential concern for groups, companies, and as well as people. As cyber threats enhance, security systems also become more sophisticated.
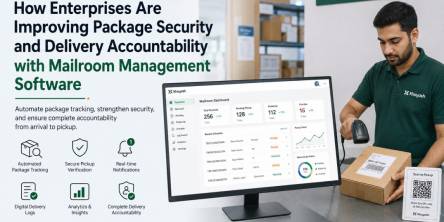
Enterprise workplaces today handle a massive volume of incoming packages, internal deliveries, courier shipments, and employee parcels every day

The adoption of cloud technologies around the world has changed the way software is consumed. Organizations now care more about agility and systems that scale with their business.
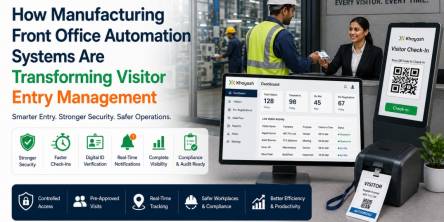
Modern industries are rapidly adopting digital transformation across operations, and manufacturing is no exception

The financial services industry is evolving. Banks, hedge funds, Fintech startups, etc. are all leveraging technology and implementing more sophisticated computational processes to keep up with the influx of information.