
Benefits of Data Visualization in Enhancing Customer Experience

Graphical presentation of data and information in visual formats like charts, maps, and graphs is termed data visualization. This method makes complex data more accessible and easily understandable bringing out the trends and patterns from raw data, which can be used to significantly enhance customer experience. Data visualization enables businesses to identify trends and patterns and draw insights from customer interaction, leading to better decision making and offering better services to enhance customer experience.
As data becomes accessible, the insights allow companies to anticipate customer requirements and address any issues promptly leading to a satisfying customer experience, higher engagement and increased loyalty.
In this blog, we will explore how data visualization enhances customer experience.
Role Of Data Visualization In Improving Customer Experience
Converting data into usable information
By using data visualization companies can transform the raw data into usable active information by presenting it in clear and visual formats like maps, graphs and charts. Transforming the raw and complex data available from customer interactions makes it possible to identify various trends and patterns. These visual information and insights can be used to make informed decisions that can enhance and improve customer experiences, enabling companies to offer more personalized services, addressing issues in a prompt manner, improvements in service and even anticipating customer requirements and needs. Using data visualization, businesses can offer customers a more satisfying and connected journey.
Insights into customer behavior
Data visualization offers awareness and understanding of the customer’s psyche and their behavior by highlighting the trends and patterns. The visual analysis generated from various points of reference helps businesses understand preferences, needs and issues related to customers. This information enables companies to design their services and products in such a way that they can meet customer expectations in an effective manner. As an example, using data visualization to understand the purchase history of customers and their feedback enables companies to address issues in a proactive manner and enhance services provided. The insights can help in creating personalized customer experiences that increase loyalty and customer engagement with products and services.
Advantage of tools and technologies
By using data visualizations to transform data and extract useful information from it, businesses take advantage of the tools and technologies to offer better customer experience. Many data visualization tools such as Tableau, Power BI, etc. let businesses design and create visual representations that can be used for understanding what the data means. These technologies can be used in real time analysis of data which enables faster identification of trends and patterns. These visual tools can be used for making data-based decisions and to personalize interactions with customers. The integration of such technologies helps create a customer experience that is responsive and personalized, thus enhancing customer experience.
Mapping customers and their experiences
Data visualization can be used to effectively map customers and their experiences visually by illustrating their interactions. This lets businesses track and analyze customer experiences in a step-by-step manner, from the initial point of contact to after sales support. These visuals can highlight the key moments such as areas of satisfaction, issues etc. and offer a through view of the customer’s journey. These insights offer businesses a way to identify the opportunities, areas where they can improve their services or products, personalize interactions and resolve issues in a proactive way. Mapping customers and their experiences offers an engaging and seamless way of enhancing customer experience to increase loyalty.
Improving communication
Businesses use data visualization to transform data into formats that are visually engaging to easily find and understand the trends and patterns from data. For example, line charts can be used to track changes over time, while bar charts can be used to compare different values over various segments. Visual data also helps companies to understand how customers behave at various points of interaction which lets them define strategies that can improve overall customer activity. Charting tools can be used to create charts like the Sankey charts that generate interactive dashboards which help companies track customer interactions in real time making it easier to respond early to any changes.
Making informed decisions
Data visualization can be used to generate predictive models that can be used to predict customer behavior and make informed decisions. Analysis of historical data can help businesses in anticipating preferences and potential opportunities. Armed with information lets them address concerns and personalize their interactions with customers. Interactive and real time dashboards can be used to generate a complete view of customer metrics and check KPIs. They can also be used to identify issues and track customer satisfaction. Data visualization uses data to generate information that can be used to make informed decisions that leads to enhanced customer experiences.
Conclusion
Leveraging data visualization services can be very beneficial for enhancing customer experience. These services can create visual representations from raw and unfiltered data to offer insights for decision making. The information can be used to make informed decisions and for personalizing interactions and creating data-based strategies, leading to enhanced customer satisfaction.
Similar Articles

The financial aid office has become one of the most operationally strained departments on the modern U.S. campus. FAFSA complexity, chronic staff turnover, tightening Title IV compliance obligations, and the persistent problem of unspent scholarship dollars have pushed administrators toward purpose-built financial aid management software
The demand for software delivery has never been higher. Applications must be delivered faster and on a scale like never before.
Modern businesses produce large amounts of data daily. Be it from customer transactions, Internet of Things (IoT) sensors, or countless other such sources.

Businesses today need to ship new software faster than ever. That's not news, of course. Anyway, because of the demands on businesses, new solutions are being built on top of micro-services, serverless functions, etc.

Cybersecurity has become an essential concern for groups, companies, and as well as people. As cyber threats enhance, security systems also become more sophisticated.
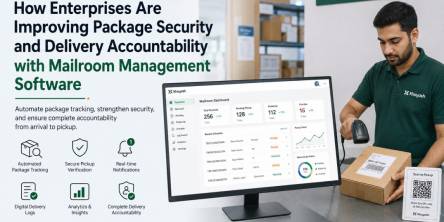
Enterprise workplaces today handle a massive volume of incoming packages, internal deliveries, courier shipments, and employee parcels every day

The adoption of cloud technologies around the world has changed the way software is consumed. Organizations now care more about agility and systems that scale with their business.
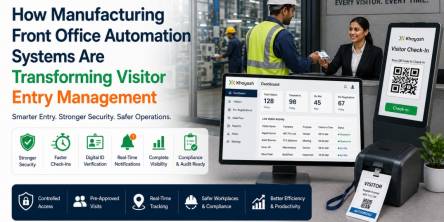
Modern industries are rapidly adopting digital transformation across operations, and manufacturing is no exception

The financial services industry is evolving. Banks, hedge funds, Fintech startups, etc. are all leveraging technology and implementing more sophisticated computational processes to keep up with the influx of information.